
draw dubin’s path practice
1
2
3
4
import numpy as np
import math
import matplotlib.pyplot as plt
plt.style.use(['dark_background'])
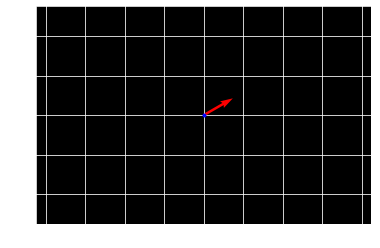
point and vector representation
1
2
3
4
x = 2
y = 1
theta = math.pi/6
x,y,theta
1
(2, 1, 0.5235987755982988)
1
2
3
v = [math.cos(theta), math.sin(theta)]
v[0]**2 + v[1]**2
v
1
[0.8660254037844387, 0.49999999999999994]
1
2
3
4
5
plt.grid(True)
plt.axis("equal")
plt.plot(x,y,'.b')
plt.quiver(x, y, v[0], v[1], color=['r'], scale=10)
plt.show()
Euler integration
it allows us to closely approximate the actual trajectory the car should follow
left turn curve segment
positive circle \(x_{t+1} = x_{t} + dt \times cos\theta \\ y_{t+1} = y_{t} + dt \times sin\theta \\ \theta_{t+1} = \theta_t + \frac{dt}{r_{turn}}\)
1
2
3
4
5
6
7
8
9
10
11
12
13
14
15
16
17
18
19
20
21
r_turn = 2
step = 0.5
x = 2
y = 1
theta = math.pi/6
v = [math.cos(theta), math.sin(theta)]
x_list = []
y_list = []
v_list = []
x_list.append(x)
y_list.append(y)
v_list.append(v)
for i in range(10):
    x = x + step * math.cos(theta)
    y = y + step * math.sin(theta)
    theta = theta + step/r_turn
    x_list.append(x)
    y_list.append(y)
    v = [math.cos(theta), math.sin(theta)]
    v_list.append(v)
v_list = np.array(v_list)
1
2
3
4
5
6
plt.cla()
plt.grid(True)
plt.axis("equal")
plt.plot(x_list,y_list,'.b')
plt.quiver(x_list, y_list, v_list[:,0], v_list[:,1], color=['r'], scale=10)
plt.show()
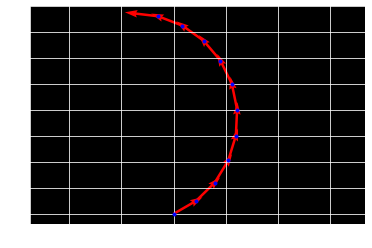
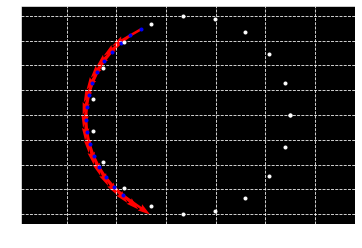
right turn curve segment
negative circle
1
2
3
4
5
6
7
8
9
10
11
12
13
14
15
16
17
18
19
20
21
22
r_turn = - 2 # it is different
#step = 0.5
step = math.pi / 2 * abs(r_turn) /10 # step_size =  angle * r_turn / step_num
x = 2
y = 1
theta = math.pi/6
v = [math.cos(theta), math.sin(theta)]
x_list = []
y_list = []
v_list = []
x_list.append(x)
y_list.append(y)
v_list.append(v)
for i in range(10):
    x = x + step * math.cos(theta)
    y = y + step * math.sin(theta)
    theta = theta + step/r_turn
    x_list.append(x)
    y_list.append(y)
    v = [math.cos(theta), math.sin(theta)]
    v_list.append(v)
v_list = np.array(v_list)
1
2
3
4
5
6
plt.cla()
plt.grid(True)
plt.axis("equal")
plt.plot(x_list,y_list,'.b')
plt.quiver(x_list, y_list, v_list[:,0], v_list[:,1], color=['r'], scale=10)
plt.show()
Find tangent line
RSR, LSL - outer tangent line 필요
RSL, LSR - inner tangent line 필요
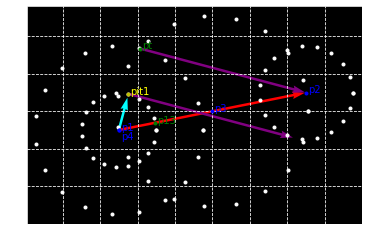
A.Geometrically commputing
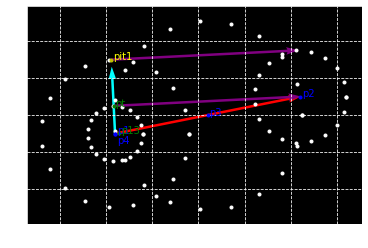
1. inner tangent line
1
2
3
4
5
6
7
8
9
10
11
12
13
14
p1 = [3.,5.]
p2 = [13.,7.]
r1 = 2.
r2 = 2.5
c1 = []
c2 = []
p3 = [(p1[0] + p2[0])/2., (p1[1] + p2[1])/2.]
d = math.sqrt((p1[0] - p2[0])**2 + (p1[1] - p2[1])**2)
r3 = d/2.
c3 = []
p4 = p1
r4 = r1 + r2
c4 = []
num = 4
1
2
v1 = [p2[0] - p1[0], p2[1] - p1[1]]
math.sqrt(v1[0]**2 + v1[1]**2), d
1
(10.198039027185569, 10.198039027185569)
1
2
3
4
5
6
for k in range(num):
    for i in np.linspace(0,math.pi*2,20):
        x = globals()['p{}'.format(k+1)][0] + globals()['r{}'.format(k+1)] * math.cos(i)
        y = globals()['p{}'.format(k+1)][1] + globals()['r{}'.format(k+1)] * math.sin(i)
        globals()['c{}'.format(k+1)].append([x,y])
    globals()['c{}'.format(k+1)] = np.array(globals()['c{}'.format(k+1)])
1
2
3
4
5
center_list = np.array([[globals()['p{}'.format(i+1)][0],globals()['p{}'.format(i+1)][1]] for i in range(num)])
circle_list = []
for i in range(num):
    circle_list.append([globals()['c{}'.format(i+1)][:,0],globals()['c{}'.format(i+1)][:,1]])
circle_list = np.array(circle_list)
Find intersection of c3,c4
1
2
dist = math.sqrt((p3[0] - p4[0])**2 + (p3[1] - p4[1])**2)
dist
1
5.0990195135927845
1
2
3
4
a = (r4**2 - r3**2 + dist**2)/(2.* dist)
h = math.sqrt((r4**2 - a**2))
p13 = [p4[0] + a * (v1[0] / d), p4[1] + a * (v1[1] / d)]
pt = [p13[0] + h * (p4[1]-p3[1])/ dist, p13[1] - h * (p4[0]-p3[0])/ dist]
1
2
3
4
5
gamma = math.atan(h/a) # pt p1 p3 angle
#gamma * 180/math.pi (63.8 degree)
theta = gamma + math.atan(v1[1]/v1[0])
# theta*180/math.pi # (75.1 degree)
p_it1 = [p1[0] + r1 * math.cos(theta), p1[1] + r1 * math.sin(theta)]
1
2
3
4
v2 = [pt[0]-p1[0],pt[1]-p1[1]]
v2_norm = math.sqrt(v2[0]**2 + v2[1]**2)
v3 =  [r1 * v2[0] / v2_norm, r1 * v2[1] / v2_norm]
v4 = [p2[0]-pt[0], p2[1]-pt[1]]
1
p_it2 = [p_it1[0] + v4[0], p_it1[1] + v4[1]]
1
center_list
1
2
3
4
array([[ 3.,  5.],
       [13.,  7.],
       [ 8.,  6.],
       [ 3.,  5.]])
1
2
3
4
5
6
7
8
9
10
11
12
13
14
15
16
17
18
19
20
21
22
23
24
plt.cla()
plt.grid(linestyle='--')
plt.axis("equal")
plt.plot(circle_list[:,0],circle_list[:,1], '.w')
plt.plot(center_list[:,0],center_list[:,1],'.b')

for i,center in enumerate(center_list):
    if i == 3:
        plt.text(center[0]+0.1, center[1]-0.5, "p{}".format(i+1), fontsize=10, color='blue')
    else:
        plt.text(center[0]+0.1, center[1], "p{}".format(i+1), fontsize=10, color='blue')

plt.plot([p13[0],pt[0]],[p13[1],pt[1]],'.g')
plt.text(p13[0]+0.1, p13[1], "p13", fontsize=10, color='green')
plt.text(pt[0]+0.1, pt[1], "pt", fontsize=10, color='green')

plt.plot(p_it1[0],p_it1[1],'.y')
plt.text(p_it1[0]+0.1, p_it1[1], "pit1", fontsize=10, color='yellow')

plt.quiver(p1[0], p1[1], v1[0], v1[1], color=['r'], scale=18)
plt.quiver(p1[0], p1[1], v3[0], v3[1], color=['cyan'], scale=20)
plt.quiver(pt[0], pt[1], v4[0], v4[1], color=['purple'], scale=18)
plt.quiver(p_it1[0], p_it1[1], v4[0], v4[1], color=['purple'], scale=18)
plt.show()
2. outer tangent line
1
2
3
4
5
6
7
8
9
10
11
12
13
14
p1 = [3.,5.]
p2 = [13.,7.]
r1 = 4.
r2 = 2.5
c1 = []
c2 = []
p3 = [(p1[0] + p2[0])/2., (p1[1] + p2[1])/2.]
d = math.sqrt((p1[0] - p2[0])**2 + (p1[1] - p2[1])**2)
r3 = d/2.
c3 = []
p4 = p1
r4 = r1 - r2
c4 = []
num = 4
1
2
3
4
5
6
7
8
9
10
11
for k in range(num):
    for i in np.linspace(0,math.pi*2,20):
        x = globals()['p{}'.format(k+1)][0] + globals()['r{}'.format(k+1)] * math.cos(i)
        y = globals()['p{}'.format(k+1)][1] + globals()['r{}'.format(k+1)] * math.sin(i)
        globals()['c{}'.format(k+1)].append([x,y])
    globals()['c{}'.format(k+1)] = np.array(globals()['c{}'.format(k+1)])
center_list = np.array([[globals()['p{}'.format(i+1)][0],globals()['p{}'.format(i+1)][1]] for i in range(num)])
circle_list = []
for i in range(num):
    circle_list.append([globals()['c{}'.format(i+1)][:,0],globals()['c{}'.format(i+1)][:,1]])
circle_list = np.array(circle_list)
1
v1 = [p2[0] - p1[0], p2[1] - p1[1]]
1
2
3
4
5
6
7
8
dist = math.sqrt((p3[0] - p4[0])**2 + (p3[1] - p4[1])**2)
a = (r4**2 - r3**2 + dist**2)/(2.* dist)
h = math.sqrt((r4**2 - a**2))
p13 = [p4[0] + a * (v1[0] / d), p4[1] + a * (v1[1] / d)]
pt = [p13[0] + h * (p4[1]-p3[1])/ dist, p13[1] - h * (p4[0]-p3[0])/ dist]
gamma = math.atan(h/a) # pt p1 p3 angle
theta = gamma + math.atan(v1[1]/v1[0])
p_it1 = [p1[0] + r1 * math.cos(theta), p1[1] + r1 * math.sin(theta)]
1
2
3
4
v2 = [pt[0]-p1[0],pt[1]-p1[1]]
v2_norm = math.sqrt(v2[0]**2 + v2[1]**2)
v3 =  [r1 * v2[0] / v2_norm, r1 * v2[1] / v2_norm]
v4 = [p2[0]-pt[0], p2[1]-pt[1]]
1
p_it2 = [p_it1[0] + v4[0], p_it1[1] + v4[1]]
1
2
3
4
5
6
7
8
9
10
11
12
13
14
15
16
17
18
19
20
21
22
23
plt.cla()
plt.grid(linestyle='--')
plt.axis("equal")
plt.plot(circle_list[:,0],circle_list[:,1], '.w')
plt.plot(center_list[:,0],center_list[:,1],'.b')
for i,center in enumerate(center_list):
    if i == 3:
        plt.text(center[0]+0.1, center[1]-0.5, "p{}".format(i+1), fontsize=10, color='blue')
    else:
        plt.text(center[0]+0.1, center[1], "p{}".format(i+1), fontsize=10, color='blue')

plt.plot([p13[0],pt[0]],[p13[1],pt[1]],'.g')
plt.text(p13[0]+0.1, p13[1], "p13", fontsize=10, color='green')
plt.text(pt[0]+0.1, pt[1], "pt", fontsize=10, color='green')

plt.plot(p_it1[0],p_it1[1],'.y')
plt.text(p_it1[0]+0.1, p_it1[1], "pit1", fontsize=10, color='yellow')

plt.quiver(p1[0], p1[1], v1[0], v1[1], color=['r'], scale=18)
plt.quiver(p1[0], p1[1], v3[0], v3[1], color=['cyan'], scale=20)
plt.quiver(pt[0], pt[1], v4[0], v4[1], color=['purple'], scale=18)
plt.quiver(p_it1[0], p_it1[1], v4[0], v4[1], color=['purple'], scale=18)
plt.show()
b. Vector based Approach
more efficient way without contructing circle C3 or C4
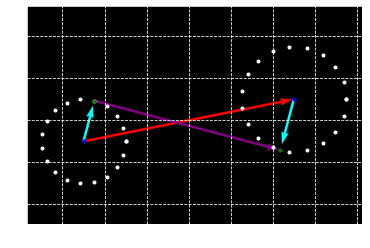
1. inner tangent line
1
2
3
4
5
6
7
8
9
10
11
12
p1 = [3.,5.]
p2 = [13.,7.]
r1 = 2.
r2 = 2.5
c1 = []
c2 = []
p3 = [(p1[0] + p2[0])/2., (p1[1] + p2[1])/2.]
d = math.sqrt((p1[0] - p2[0])**2 + (p1[1] - p2[1])**2)
r3 = d/2.
p4 = p1
r4 = r1 + r2
num = 2
1
2
3
4
5
6
7
8
9
10
11
for k in range(num):
    for i in np.linspace(0,math.pi*2,20):
        x = globals()['p{}'.format(k+1)][0] + globals()['r{}'.format(k+1)] * math.cos(i)
        y = globals()['p{}'.format(k+1)][1] + globals()['r{}'.format(k+1)] * math.sin(i)
        globals()['c{}'.format(k+1)].append([x,y])
    globals()['c{}'.format(k+1)] = np.array(globals()['c{}'.format(k+1)])
center_list = np.array([[globals()['p{}'.format(i+1)][0],globals()['p{}'.format(i+1)][1]] for i in range(num)])
circle_list = []
for i in range(num):
    circle_list.append([globals()['c{}'.format(i+1)][:,0],globals()['c{}'.format(i+1)][:,1]])
circle_list = np.array(circle_list)
1
2
3
v1 = [p2[0] - p1[0], p2[1] - p1[1]]
d = math.sqrt((p2[0] - p1[0])**2 + (p2[1] - p1[1])**2)
v1,d
1
([10.0, 2.0], 10.198039027185569)
1
2
3
4
5
6
7
8
c = (r1 + r2)/d #cos angle v1 and n (normal vertor of v2)
v1x = v1[0] / d
v1y = v1[1] / d
n = [v1x * c - v1y * math.sqrt(1 - c**2), v1x * math.sqrt(1 - c**2) + v1y * c] # rotate v1
pot1 = [p1[0] + r1 * n[0], p1[1] + r1 * n[1]]
pot2 = [p2[0] - r2 * n[0], p2[1] - r2 * n[1]]
v2 = [pot2[0] - pot1[0], pot2[1] - pot1[1]]
v2
1
[8.844841571920712, -2.3492078596035615]
1
2
3
4
5
6
7
8
9
10
11
plt.cla()
plt.grid(linestyle='--')
plt.axis("equal")
plt.plot(circle_list[:,0],circle_list[:,1], '.w')
plt.plot(center_list[:,0],center_list[:,1],'.b')
plt.plot([pot1[0],pot2[0]],[pot1[1],pot2[1]],'.g')
plt.quiver(p1[0], p1[1], v1[0], v1[1], color=['r'], scale=16)
plt.quiver(p1[0], p1[1], r1 * n[0], r1 * n[1], color=['cyan'], scale=18)
plt.quiver(p2[0], p2[1], -r2 * n[0], -r2 * n[1], color=['cyan'], scale=18)
plt.quiver(pot1[0], pot1[1], v2[0], v2[1], color=['purple'], scale=16)
plt.show()
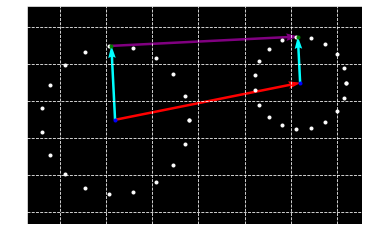
2. outer tangent line
1
2
3
4
5
6
7
p1 = [3.,5.]
p2 = [13.,7.]
r1 = 4.
r2 = 2.5
c1 = []
c2 = []
num = 2
1
2
3
4
5
6
7
8
9
10
11
for k in range(num):
    for i in np.linspace(0,math.pi*2,20):
        x = globals()['p{}'.format(k+1)][0] + globals()['r{}'.format(k+1)] * math.cos(i)
        y = globals()['p{}'.format(k+1)][1] + globals()['r{}'.format(k+1)] * math.sin(i)
        globals()['c{}'.format(k+1)].append([x,y])
    globals()['c{}'.format(k+1)] = np.array(globals()['c{}'.format(k+1)])
center_list = np.array([[globals()['p{}'.format(i+1)][0],globals()['p{}'.format(i+1)][1]] for i in range(num)])
circle_list = []
for i in range(num):
    circle_list.append([globals()['c{}'.format(i+1)][:,0],globals()['c{}'.format(i+1)][:,1]])
circle_list = np.array(circle_list)
1
2
3
v1 = [p2[0] - p1[0], p2[1] - p1[1]]
d = math.sqrt((p2[0] - p1[0])**2 + (p2[1] - p1[1])**2)
v1,d
1
([10.0, 2.0], 10.198039027185569)
1
c = (r1 - r2)/d #cos angle v1 and n (normal vertor of v2)
1
2
3
4
5
6
7
v1x = v1[0] / d
v1y = v1[1] / d
n = [v1x * c - v1y * math.sqrt(1 - c**2), v1x * math.sqrt(1 - c**2) + v1y * c] # rotate v1
pot1 = [p1[0] + r1 * n[0], p1[1] + r1 * n[1]]
pot2 = [p2[0] + r2 * n[0], p2[1] + r2 * n[1]]
v2 = [pot2[0] - pot1[0], pot2[1] - pot1[1]]
v2
1
[10.07462847598796, 0.501857620060191]
1
2
3
4
5
6
7
8
9
10
11
plt.cla()
plt.grid(linestyle='--')
plt.axis("equal")
plt.plot(circle_list[:,0],circle_list[:,1], '.w')
plt.plot(center_list[:,0],center_list[:,1],'.b')
plt.plot([pot1[0],pot2[0]],[pot1[1],pot2[1]],'.g')
plt.quiver(p1[0], p1[1], v1[0], v1[1], color=['r'], scale=18)
plt.quiver(p1[0], p1[1], r1 * n[0], r1 * n[1], color=['cyan'], scale=18)
plt.quiver(p2[0], p2[1], r2 * n[0], r2 * n[1], color=['cyan'], scale=18)
plt.quiver(pot1[0], pot1[1], v2[0], v2[1], color=['purple'], scale=18)
plt.show()
$r_1 < r_2 $ 일 때 $cos(\pi-\theta) = -cos\theta$ 이기 때문에 둘다 같은 식이 된다.
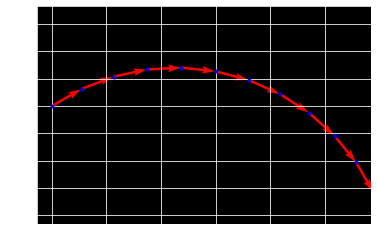
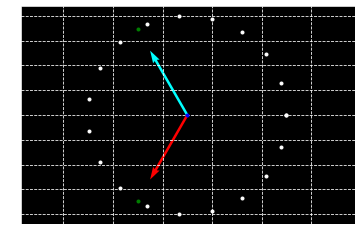
Computing Arc length
1
2
3
4
5
6
7
8
9
10
11
12
p1 = [3.,5.]
r1 = 4.
c1 = []
for i in np.linspace(0,math.pi*2,20):
    x = p1[0] + r1 * math.cos(i)
    y = p1[1] + r1 * math.sin(i)
    c1.append([x,y])
c1 = np.array(c1)
v1 = [r1 * math.cos(2. / 3. * math.pi), r1 * math.sin(2. / 3. * math.pi)]
v2 = [r1 * math.cos(4. / 3. * math.pi), r1 * math.sin(4. / 3. * math.pi)]
p2 = [p1[0] + v1[0], p1[1] + v1[1]]
p3 = [p1[0] + v2[0], p1[1] + v2[1]]
atan2(y,x)
when it has negative value, turn left
when it has positive value, turn right
1
2
theta = math.atan2(v2[1],v2[0]) - math.atan2(v1[1],v1[0])
theta*180/math.pi
1
-240.00000000000003
1
2
3
4
5
6
7
8
9
10
11
12
def arclength(v1,v2,r, d):
    '''
    d = 0 left turn
    d = 1 right turn
    '''
    theta = math.atan2(v2[1],v2[0]) - math.atan2(v1[1],v1[0])
    if theta < 0 and d is 0:
        theta += math.pi * 2.
    elif theta > 0  and d is 1:
        theta -= math.pi * 2.
    return abs(theta * r)
1
arclength(v1,v2,r1,0)
1
8.37758040957278
1
2
3
4
5
6
7
8
9
plt.cla()
plt.grid(linestyle='--')
plt.axis("equal")
plt.plot(c1[:,0],c1[:,1], '.w')
plt.plot(p1[0],p1[1],'.b')
plt.plot([p2[0],p3[0]],[p2[1],p3[1]],'.g')
plt.quiver(p1[0], p1[1], v1[0], v1[1], color=['cyan'], scale=18)
plt.quiver(p1[0], p1[1], v2[0], v2[1], color=['red'], scale=18)
plt.show()
1
2
3
4
5
6
7
8
9
10
11
12
13
14
15
16
17
18
19
20
21
22
r_turn = r1
step = 0.5
step_num = int(arclength(v1,v2,r1,0) / step)
x = p2[0]
y = p2[1]
theta = -(5./6.) * math.pi
v = [math.cos(theta), math.sin(theta)]
x_list = []
y_list = []
v_list = []
x_list.append(x)
y_list.append(y)
v_list.append(v)
for i in range(step_num):
    x = x + step * math.cos(theta)
    y = y + step * math.sin(theta)
    theta = theta + step/r_turn
    x_list.append(x)
    y_list.append(y)
    v = [math.cos(theta), math.sin(theta)]
    v_list.append(v)
v_list = np.array(v_list)
1
2
3
4
5
6
7
8
plt.cla()
plt.grid(True)
plt.grid(linestyle='--')
plt.axis("equal")
plt.plot(x_list,y_list,'.b')
plt.plot(c1[:,0],c1[:,1], '.w')
plt.quiver(x_list, y_list, v_list[:,0], v_list[:,1], color=['r'], scale=10)
plt.show()
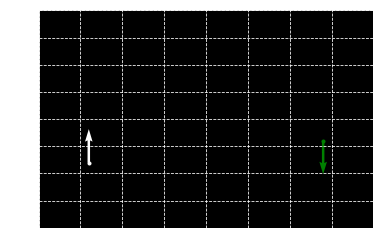
Geometry of CSC trajectories
1
2
3
4
5
6
#configuration
s = np.array([-2.,1.,math.pi*(1./2.)])
s_v = np.array([math.cos(s[2]), math.sin(s[2])])
g = np.array([12.,3.,math.pi*(3./2.)])
g_v = np.array([math.cos(g[2]), math.sin(g[2])])
1
2
3
4
5
6
7
8
9
10
11
plt.cla()
plt.grid(True)
plt.grid(linestyle='--')
axes = plt.gca()
axes.set_xlim([-5,15])
axes.set_ylim([-5,15])
plt.plot(s[0],s[1],'.w')
plt.plot(g[0],g[1], '.g')
plt.quiver(s[0], s[1], s_v[0], s_v[1], color=['w'], scale=10)
plt.quiver(g[0], g[1], g_v[0], g_v[1], color=['g'], scale=10)
plt.show()
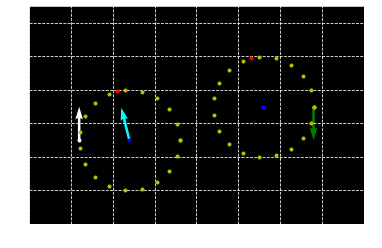
Find center of circle with r_min
turn right with negative radius
drive straight
turn right with negative radius
1
2
3
4
5
6
7
8
9
def mkvector(p1,p2):
    return np.array([p2[0] - p1[0], p2[1] - p1[1]])
def vector(theta):
    return np.array([math.cos(theta),math.sin(theta)])
def rot_mat(theta):
    return np.array([[math.cos(theta), -math.sin(theta)],[math.sin(theta), math.cos(theta)]])
def rot_mat(c):
    s = math.sqrt(1-c**2)
    return np.array([[c, -s],[s, c]])
1
2
3
rmin = 3.
p_c1 = s[:2] + rmin * vector(s[2] - math.pi/2.)
p_c2 = g[:2] + rmin * vector(g[2] - math.pi/2.)
1
2
3
4
5
6
7
8
9
10
11
12
c1 = []
for i in np.linspace(0,math.pi*2,20):
    x = p_c1[0] + rmin * math.cos(i)
    y = p_c1[1] + rmin * math.sin(i)
    c1.append([x,y])
c2 = []
for i in np.linspace(0,math.pi*2,20):
    x = p_c2[0] + rmin * math.cos(i)
    y = p_c2[1] + rmin * math.sin(i)
    c2.append([x,y])
c1 = np.array(c1)
c2 = np.array(c2)
Find outer tangent points
1
2
3
4
5
6
v1 = np.array([p_c2[0] - p_c1[0], p_c2[1] - p_c1[1]])
d = np.linalg.norm(v1,2)
c = (rmin - rmin)/d
n = np.matmul(rot_mat(c), (v1/d))
pot1 = p_c1 + rmin * n
pot2 = p_c2 + rmin * n
1
2
3
4
5
6
7
8
9
10
11
12
13
14
15
16
plt.cla()
plt.grid(True)
plt.grid(linestyle='--')
plt.axis('equal')
axes = plt.gca()
axes.set_xlim([-5,15])
axes.set_ylim([-10,15])
plt.plot(s[0],s[1],'.w')
plt.plot(g[0],g[1], '.g')
plt.quiver(s[0], s[1], s_v[0], s_v[1], color=['w'], scale=10)
plt.quiver(g[0], g[1], g_v[0], g_v[1], color=['g'], scale=10)
plt.quiver(p_c1[0], p_c1[1], n[0], n[1], color=['cyan'], scale=10)
plt.plot([p_c1[0], p_c2[0]], [p_c1[1], p_c2[1]], '.b')
plt.plot([pot1[0],pot2[0]],[pot1[1],pot2[1]],'.r')
plt.plot([c1[:,0],c2[:,0]],[c1[:,1],c2[:,1]],'.y')
plt.show()
Define control as pairs
for above example, we have an array of 3 controls
(-steeringmax, timestep1),(0,timestep2),(-steeringmax, timestep3)
1
2
3
arc1 = arclength(mkvector(p_c1,s[:2]),mkvector(p_c1,pot1), rmin, 1)
arc2 = arclength(mkvector(p_c2,pot2),mkvector(p_c1,g[:2]), rmin, 1)
arc1,arc2
1
(3.977452991004097, 4.907764470387846)
1
2
3
st_v = v1
line = np.linalg.norm(st_v,2)
st_v, line
1
(array([8., 2.]), 8.246211251235321)
1 section
1
2
3
4
5
6
7
8
9
10
11
12
13
14
15
16
17
18
19
20
21
22
r_turn = -rmin
step = 0.5
step_num = int(arc1 / step)
x = s[0]
y = s[1]
theta = s[2]
v = [math.cos(theta), math.sin(theta)]
x1_list = []
y1_list = []
v1_list = []
x1_list.append(x)
y1_list.append(y)
v1_list.append(v)
for i in range(step_num+1):
    x = x + step * math.cos(theta)
    y = y + step * math.sin(theta)
    theta = theta + step/r_turn
    x1_list.append(x)
    y1_list.append(y)
    v = [math.cos(theta), math.sin(theta)]
    v1_list.append(v)
v1_list = np.array(v1_list)
1
2
3
4
5
6
7
8
9
10
11
12
13
14
15
16
17
18
19
plt.cla()
plt.grid(True)
plt.grid(linestyle='--')
plt.axis("equal")
axes = plt.gca()
axes.set_xlim([-5,15])
axes.set_ylim([-10,15])
plt.plot(s[0],s[1],'.w')
plt.plot(g[0],g[1], '.g')
plt.quiver(s[0], s[1], s_v[0], s_v[1], color=['w'], scale=10)
plt.quiver(g[0], g[1], g_v[0], g_v[1], color=['g'], scale=10)
plt.quiver(p_c1[0], p_c1[1], n[0], n[1], color=['cyan'], scale=10)
plt.plot([p_c1[0], p_c2[0]], [p_c1[1], p_c2[1]], '.b')
plt.plot([pot1[0],pot2[0]],[pot1[1],pot2[1]],'.r')
plt.plot([c1[:,0],c2[:,0]],[c1[:,1],c2[:,1]],'.y')

plt.plot(x1_list,y1_list,'.r')
plt.quiver(x1_list, y1_list, v1_list[:,0], v1_list[:,1], color=['w'], scale=10)
plt.show()
2 section
1
2
3
4
5
6
7
8
9
10
11
12
13
14
15
16
step = 0.5
step_num = int(line / step)
v = st_v/line
x2_list = []
y2_list = []
v2_list = []
x2_list.append(x)
y2_list.append(y)
v2_list.append(v)
for i in range(step_num+1):
    x = x + step * v[0]
    y = y + step * v[1]
    x2_list.append(x)
    y2_list.append(y)
    v2_list.append(v)
v2_list = np.array(v2_list)
1
2
3
4
5
6
7
8
9
10
11
12
13
14
15
16
17
18
19
20
21
plt.cla()
plt.grid(True)
plt.grid(linestyle='--')
plt.axis("equal")
axes = plt.gca()
axes.set_xlim([-5,15])
axes.set_ylim([-10,15])
plt.plot(s[0],s[1],'.w')
plt.plot(g[0],g[1], '.g')
plt.quiver(s[0], s[1], s_v[0], s_v[1], color=['w'], scale=10)
plt.quiver(g[0], g[1], g_v[0], g_v[1], color=['g'], scale=10)
plt.quiver(p_c1[0], p_c1[1], n[0], n[1], color=['cyan'], scale=10)
plt.plot([p_c1[0], p_c2[0]], [p_c1[1], p_c2[1]], '.b')
plt.plot([pot1[0],pot2[0]],[pot1[1],pot2[1]],'.r')
plt.plot([c1[:,0],c2[:,0]],[c1[:,1],c2[:,1]],'.y')

plt.plot(x1_list,y1_list,'.r')
plt.quiver(x1_list, y1_list, v1_list[:,0], v1_list[:,1], color=['w'], scale=10)
plt.plot(x2_list,y2_list,'.r')
plt.quiver(x2_list, y2_list, v2_list[:,0], v2_list[:,1], color=['w'], scale=10)
plt.show()
3 section
1
2
3
4
5
6
7
8
9
10
11
12
13
14
15
16
17
18
19
20
21
22
r_turn = -rmin
step = 0.5
step_num = int(arc2 / step)
x = pot2[0]
y = pot2[1]
theta = math.atan2(st_v[1],st_v[0])
v = [math.cos(theta), math.sin(theta)]
x3_list = []
y3_list = []
v3_list = []
x3_list.append(x)
y3_list.append(y)
v3_list.append(v)
for i in range(step_num+1):
    x = x + step * math.cos(theta)
    y = y + step * math.sin(theta)
    theta = theta + step/r_turn
    x3_list.append(x)
    y3_list.append(y)
    v = [math.cos(theta), math.sin(theta)]
    v3_list.append(v)
v3_list = np.array(v3_list)
1
2
3
4
5
6
7
8
9
10
11
12
13
14
15
16
17
18
19
20
21
22
23
plt.cla()
plt.grid(True)
plt.grid(linestyle='--')
plt.axis("equal")
axes = plt.gca()
axes.set_xlim([-5,15])
axes.set_ylim([-10,15])
plt.plot(s[0],s[1],'.w')
plt.plot(g[0],g[1], '.g')
plt.quiver(s[0], s[1], s_v[0], s_v[1], color=['w'], scale=10)
plt.quiver(g[0], g[1], g_v[0], g_v[1], color=['g'], scale=10)
plt.quiver(p_c1[0], p_c1[1], n[0], n[1], color=['cyan'], scale=10)
plt.plot([p_c1[0], p_c2[0]], [p_c1[1], p_c2[1]], '.b')
plt.plot([pot1[0],pot2[0]],[pot1[1],pot2[1]],'.r')
plt.plot([c1[:,0],c2[:,0]],[c1[:,1],c2[:,1]],'.y')

plt.plot(x1_list,y1_list,'.r')
plt.quiver(x1_list, y1_list, v1_list[:,0], v1_list[:,1], color=['w'], scale=10)
plt.plot(x2_list,y2_list,'.r')
plt.quiver(x2_list, y2_list, v2_list[:,0], v2_list[:,1], color=['w'], scale=10)
plt.plot(x3_list,y3_list,'.r')
plt.quiver(x3_list, y3_list, v3_list[:,0], v3_list[:,1], color=['w'], scale=10)
plt.show()
computing CCC trajectories
RLR LRL trajectories
3 tangential minimum radius turning circles
조건 : 3개의 원을 배치할 만큼 중분히 가까워야 함
삼각형을 만들어야 되므로
turning circle의 중심간의 거리 (d) 가 4 * rmin 보다 작아야한다.
\(d < 4 \times r_{min}\)
LRL로 예시를 들어보자
1
2
3
4
5
6
#configuration
s = np.array([1.,-3.,math.pi*(1./6.)])
s_v = np.array([math.cos(s[2]), math.sin(s[2])])
g = np.array([3.,11.,math.pi*(5./6.)])
g_v = np.array([math.cos(g[2]), math.sin(g[2])])
1
2
3
4
5
6
7
8
9
10
11
12
13
14
15
rmin = - 3. # when we want to find left tantial circle, make it negative
p1 = s[:2] + rmin * vector(s[2] - math.pi/2.)
p2 = g[:2] + rmin * vector(g[2] - math.pi/2.)
c1 = []
for i in np.linspace(0,math.pi*2,20):
    x = p1[0] + rmin * math.cos(i)
    y = p1[1] + rmin * math.sin(i)
    c1.append([x,y])
c2 = []
for i in np.linspace(0,math.pi*2,20):
    x = p2[0] + rmin * math.cos(i)
    y = p2[1] + rmin * math.sin(i)
    c2.append([x,y])
c1 = np.array(c1)
c2 = np.array(c2)
find tangential circle c3
1
2
3
4
5
6
7
v1 = mkvector(p1,p2)
d = np.linalg.norm(v1,2)
theta =   math.atan2(v1[1],v1[0]) - math.acos(d/(4*abs(rmin)))
v2 = 2 * abs(rmin) * vector(theta) #
p3 = p1 + v2
pt1 = p1 + abs(rmin) * v2 / np.linalg.norm(v2)
theta, v2, p3, pt1
1
2
3
4
(0.6282353408868067,
 array([4.85439534, 3.52630769]),
 array([4.35439534, 3.1243839 ]),
 array([1.92719767, 1.36123006]))
1
math.atan2(v1[1],v1[0])*180/math.pi, theta*180/math.pi
1
(77.20114548494976, 35.99523357377659)
1
2
3
4
5
6
c3 = []
for i in np.linspace(0,math.pi*2,20):
    x = p3[0] + rmin * math.cos(i)
    y = p3[1] + rmin * math.sin(i)
    c3.append([x,y])
c3 = np.array(c3)
1
2
v3 = mkvector(p3,p2)
pt2 = p3 + abs(rmin) * v3 / np.linalg.norm(v3,2)
1
2
3
4
5
6
7
8
9
10
11
12
13
14
15
plt.cla()
plt.grid(True)
plt.grid(linestyle='--')
plt.axis("equal")
plt.plot(s[0],s[1],'.w')
plt.plot(g[0],g[1], '.g')
plt.quiver(s[0], s[1], s_v[0], s_v[1], color=['w'], scale=10)
plt.quiver(g[0], g[1], g_v[0], g_v[1], color=['g'], scale=10)
plt.plot([p1[0], p2[0],p3[0]], [p1[1], p2[1],p3[1]], '.b')
plt.plot([pt1[0],pt2[0]],[pt1[1],pt2[1]],'.r')
plt.plot([c1[:,0],c2[:,0],c3[:,0]],[c1[:,1],c2[:,1],c3[:,1]],'.y')
plt.quiver(p1[0], p1[1], v1[0], v1[1], color=['b'], scale=25)
plt.quiver(p1[0], p1[1], v2[0], v2[1], color=['b'], scale=25)
plt.quiver(p3[0], p3[1], v3[0], v3[1], color=['b'], scale=25)
plt.show()
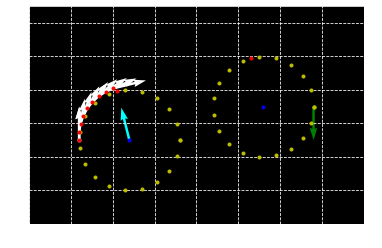
1 section
1
2
3
4
arc1 = arclength(mkvector(p1,s[:2]),mkvector(p1,pt1),rmin,0)
arc2 = arclength(mkvector(p3,pt1),mkvector(p3,pt2),rmin,1)
arc3 = arclength(mkvector(p2,pt2),mkvector(p2,g[:2]),rmin,0)
arc1,arc2,arc3
1
(5.026298676250213, 5.109704955949054, 6.366591586878428)
1
2
3
4
5
6
7
8
9
10
11
12
13
14
15
16
17
18
19
20
21
22
r_turn = -rmin
step = 0.5
step_num = int(arc1 / step)
x = s[0]
y = s[1]
theta = s[2]
v = [math.cos(theta), math.sin(theta)]
x1_list = []
y1_list = []
v1_list = []
x1_list.append(x)
y1_list.append(y)
v1_list.append(v)
for i in range(step_num+1):
    x = x + step * math.cos(theta)
    y = y + step * math.sin(theta)
    theta = theta + step/r_turn
    x1_list.append(x)
    y1_list.append(y)
    v = [math.cos(theta), math.sin(theta)]
    v1_list.append(v)
v1_list = np.array(v1_list)
2 section
1
2
3
4
5
6
7
8
9
10
11
12
13
14
15
16
17
18
19
20
21
22
r_turn = rmin
step = 0.5
step_num = int(arc2 / step)
x = pt1[0]
y = pt1[1]
theta = math.atan2(mkvector(pt1,p3)[1],mkvector(pt1,p3)[0]) + (math.pi/2)
v = [math.cos(theta), math.sin(theta)]
x2_list = []
y2_list = []
v2_list = []
x2_list.append(x)
y2_list.append(y)
v2_list.append(v)
for i in range(step_num+1):
    x = x + step * math.cos(theta)
    y = y + step * math.sin(theta)
    theta = theta + step/r_turn
    x2_list.append(x)
    y2_list.append(y)
    v = [math.cos(theta), math.sin(theta)]
    v2_list.append(v)
v2_list = np.array(v2_list)
3 section
1
2
3
4
5
6
7
8
9
10
11
12
13
14
15
16
17
18
19
20
21
22
r_turn = -rmin
step = 0.5
step_num = int(arc3 / step)
x = pt2[0]
y = pt2[1]
theta = math.atan2(mkvector(pt2,p2)[1],mkvector(pt2,p2)[0]) - (math.pi/2)
v = [math.cos(theta), math.sin(theta)]
x3_list = []
y3_list = []
v3_list = []
x3_list.append(x)
y3_list.append(y)
v3_list.append(v)
for i in range(step_num+1):
    x = x + step * math.cos(theta)
    y = y + step * math.sin(theta)
    theta = theta + step/r_turn
    x3_list.append(x)
    y3_list.append(y)
    v = [math.cos(theta), math.sin(theta)]
    v3_list.append(v)
v3_list = np.array(v3_list)
1
2
3
4
5
6
7
8
9
10
11
12
13
14
15
16
17
18
19
20
21
22
plt.cla()
plt.grid(True)
plt.grid(linestyle='--')
plt.axis("equal")
plt.plot(s[0],s[1],'.w')
plt.plot(g[0],g[1], '.g')
plt.quiver(s[0], s[1], s_v[0], s_v[1], color=['w'], scale=10)
plt.quiver(g[0], g[1], g_v[0], g_v[1], color=['g'], scale=10)
plt.plot([p1[0], p2[0],p3[0]], [p1[1], p2[1],p3[1]], '.b')
plt.plot([pt1[0],pt2[0]],[pt1[1],pt2[1]],'.r')
plt.plot([c1[:,0],c2[:,0],c3[:,0]],[c1[:,1],c2[:,1],c3[:,1]],'.y')
plt.quiver(p1[0], p1[1], v1[0], v1[1], color=['b'], scale=25)
plt.quiver(p1[0], p1[1], v2[0], v2[1], color=['b'], scale=25)
plt.quiver(p3[0], p3[1], v3[0], v3[1], color=['b'], scale=25)

plt.plot(x1_list,y1_list,'.r')
plt.quiver(x1_list, y1_list, v1_list[:,0], v1_list[:,1], color=['w'], scale=20)
plt.plot(x2_list,y2_list,'.r')
plt.quiver(x2_list, y2_list, v2_list[:,0], v2_list[:,1], color=['w'], scale=20)
plt.plot(x3_list,y3_list,'.r')
plt.quiver(x3_list, y3_list, v3_list[:,0], v3_list[:,1], color=['w'], scale=20)
plt.show()
위의 내용을 기반으로 함수를 만들어보자
1
import pdb
1
2
3
4
5
6
7
8
9
10
11
12
13
14
15
16
17
18
19
20
21
22
23
24
25
26
27
28
29
30
31
32
33
34
35
36
37
38
39
40
41
42
43
44
45
46
47
48
49
50
51
52
53
54
55
56
57
58
59
60
61
62
63
64
65
66
67
68
69
70
71
72
73
74
75
76
77
78
79
80
81
82
83
84
85
86
87
88
89
90
91
92
93
94
95
96
97
98
99
100
101
102
103
104
105
106
107
108
109
110
111
112
113
114
115
116
117
118
119
120
121
122
123
124
125
126
127
128
129
130
131
132
133
134
135
136
137
138
139
140
141
142
143
144
145
146
147
148
149
150
151
152
153
154
155
156
157
158
159
160
161
162
163
164
165
166
167
168
169
170
171
172
173
174
175
176
177
178
179
180
181
182
183
184
185
186
187
188
189
190
191
192
193
194
195
196
197
198
199
200
201
202
203
204
205
206
207
208
209
210
211
212
213
214
215
216
217
218
219
220
221
222
223
224
225
226
227
228
229
230
231
232
233
234
235
236
237
238
239
240
241
242
243
244
def mkvector_pt(p1,p2):
    vector = p2 - p1
    d = np.linalg.norm(vector)
    return vector/d, d

def mkvector_theta(theta):
    return np.array([math.cos(theta),math.sin(theta)]).reshape(-1,1)

def rot_mat_theta(theta):
    return np.array([[math.cos(theta), -math.sin(theta)],[math.sin(theta), math.cos(theta)]])

def rot_mat_cos(c, r):
    '''
    for right circle(r<0), we need upper tangential line
    for left circle(r>0), we need lower tangential line
    '''
    s = math.sqrt(1-c**2)
    if r > 0:
        s = -s
    return np.array([[c, -s],[s, c]])

def in_tangential(c1, c2, r1, r2):
    c1 = np.array(c1).reshape(-1,1)
    c2 = np.array(c2).reshape(-1,1)

    v1, d1 = mkvector_pt(c1,c2)
    c = (r1 + r2) / d1
    rot_mat = rot_mat_cos(c, r1)
    n = np.matmul(rot_mat, v1)

    pt1 = c1 + abs(r1)* n
    pt2 = c2 - abs(r2)* n

    v2, d2 = mkvector_pt(pt1, pt2)

    return v2, d2, pt1, pt2

def out_tangential(c1, c2, r1, r2):
    c1 = np.array(c1).reshape(-1,1)
    c2 = np.array(c2).reshape(-1,1)
    v1, d1 = mkvector_pt(c1,c2)

    c = (r1 - r2) / d1
    rot_mat = rot_mat_cos(c, r1)

    n = np.matmul(rot_mat, v1)

    pt1 = c1 + abs(r1)* n
    pt2 = c2 + abs(r2)* n

    v2, d2 = mkvector_pt(pt1, pt2)

    return v2, d2, pt1, pt2

def tangential_circle(c1, c2, v1, d1, rmin):

    if rmin > 0:
        theta = math.atan2(v1[:,0][1],v1[:,0][0]) - math.acos(d/(4*abs(rmin)))
    elif rmin < 0:
        theta = math.atan2(v1[:,0][1],v1[:,0][0]) + math.acos(d/(4*abs(rmin)))
    else:
        print("check radius!")

    v2 = mkvector_theta(theta)
    pt1 = c1 + abs(rmin) * v2
    c3 = c1 + 2 * abs(rmin) * v2

    v3, _ = mkvector_pt(c3,c2)
    pt2 = c3 + abs(rmin) * v3

    return pt1, pt2, c3

def arclength(s, pt, c, r, d):
    '''
    d = 0 left turn along with left tangential circle
    d = 1 right turn along with right tangential circle
    '''
    c = np.array(c)
    s = np.array(s)

    v1, _ = mkvector_pt(c, s)
    v2, _ = mkvector_pt(c, pt)

    theta = math.atan2(v2[1],v2[0]) - math.atan2(v1[1],v1[0])
    if theta < 0 and d is 0:
        theta += math.pi * 2.
    elif theta > 0  and d is 1:
        theta -= math.pi * 2.
    return abs(theta * r)

def CSCtraj(s_pt, g_pt, s_yaw, s_v, g_v, rot_mat1, rot_mat2, r_turn1, r_turn2, step=0.5):
    CSC_traj = []
    p1 = s_pt  + abs(r_turn1)*np.matmul(rot_mat1, s_v)
    p2 = g_pt  + abs(r_turn2)*np.matmul(rot_mat2, g_v)

    if r_turn1 * r_turn2 < 0: # LCR, RCL
        v2, d2, pt1, pt2 = in_tangential(p1, p2, r_turn1, r_turn2)
    elif r_turn1 * r_turn2 > 0: # RCR, LCL
        v2, d2, pt1, pt2 = out_tangential(p1, p2, r_turn1, r_turn2)
    else:
        print("check radius!")

    dr1 = 1 if r_turn1 < 0 else 0
    dr2 = 1 if r_turn2 < 0 else 0
    arc1 = arclength(s_pt.reshape(-1) ,pt1.reshape(-1) ,p1.reshape(-1) , abs(r_turn1), dr1)
    arc2 = arclength(pt2.reshape(-1) ,g_pt.reshape(-1) ,p2.reshape(-1) , abs(r_turn2), dr2)

    step_num1 = int(arc1 / step)
    step_num2 = int(d2 / step)
    step_num3 = int(arc2 / step)

    # section 1

    # car initial state
    x = s_pt[:,0][0]
    y = s_pt[:,0][1]
    theta = s_yaw

    for i in range(step_num1+1):
        x = x + step * math.cos(theta)
        y = y + step * math.sin(theta)
        theta = theta + step/r_turn1
        CSC_traj.append([x,y,theta])

    # section 2

#     car state
#     x = pt1[:,0][0]
#     y = pt1[:,0][1]

    for i in range(step_num2+1):
        x = x + step * v2[:,0][0]
        y = y + step * v2[:,0][1]
        CSC_traj.append([x,y,theta])

    # section 3

    # car state
#     x = pt2[:,0][0]
#     y = pt2[:,0][1]
#     theta = math.atan2(v2[1],v2[0])

    for i in range(step_num3+1):
        x = x + step * math.cos(theta)
        y = y + step * math.sin(theta)
        theta = theta + step/r_turn2
        CSC_traj.append([x,y,theta])

    return np.array(CSC_traj)

def CCCtraj(s_pt, g_pt, s_yaw, s_v, g_v, rot_mat1, rot_mat2, r_min, step=0.5):
    CCC_traj = []
    p1 = s_pt  + abs(r_min)*np.matmul(rot_mat1, s_v)
    p2 = g_pt  + abs(r_min)*np.matmul(rot_mat2, g_v)

    v1,d1 = mkvector_pt(p1,p2)
    if d1 > 4*abs(r_min):
        print("CCC condition is not satisfied!")
        return np.array(CCC_traj), False

    pt1, pt2, p3 = tangential_circle(p1, p2, v1, d1, r_min)

    dr1, dr2, dr3  = (1,0,1) if r_min < 0 else (0,1,0)

    arc1 = arclength(s_pt.reshape(-1), pt1.reshape(-1), p1.reshape(-1), abs(r_min), dr1)
    arc2 = arclength(pt1.reshape(-1), pt2.reshape(-1), p3.reshape(-1), abs(r_min), dr2)
    arc3 = arclength(pt2.reshape(-1), g_pt.reshape(-1),  p2.reshape(-1), abs(r_min), dr3)

    step_num1 = int(arc1 / step)
    step_num2 = int(arc2 / step)
    step_num3 = int(arc3 / step)

    # section 1

    # car initial state
    x = s_pt[:,0][0]
    y = s_pt[:,0][1]
    theta = s_yaw

    for i in range(step_num1+1):
        x = x + step * math.cos(theta)
        y = y + step * math.sin(theta)
        theta = theta + step/r_min
        CCC_traj.append([x,y,theta])

    # section 2

    for i in range(step_num2+1):
        x = x + step * math.cos(theta)
        y = y + step * math.sin(theta)
        theta = theta - step/r_min
        CCC_traj.append([x,y,theta])

    # section 3

    for i in range(step_num3+1):
        x = x + step * math.cos(theta)
        y = y + step * math.sin(theta)
        theta = theta + step/r_min
        CCC_traj.append([x,y,theta])

    return np.array(CCC_traj), True

def mk_traj(s, g, r1 = 2.5 , r2 = 2.5 , type='RSL', step=0.5):
    s_pt = s[:2].reshape(-1,1)
    g_pt = g[:2].reshape(-1,1)
    s_yaw = s[2]
    g_yaw = g[2]
    ccc_check = False

    s_v = mkvector_theta(s_yaw)
    g_v = mkvector_theta(g_yaw)

    R_rot_mat = rot_mat_theta(-math.pi/2)
    L_rot_mat = rot_mat_theta(math.pi/2)

    if type == 'LRL':
        traj, ccc_check = CCCtraj(s_pt, g_pt, s_yaw, s_v, g_v,
                       rot_mat1=L_rot_mat, rot_mat2=L_rot_mat,
                       r_min=r1, step=step)
    elif type == 'RLR':
        traj, ccc_check = CCCtraj(s_pt, g_pt, s_yaw, s_v, g_v,
                       rot_mat1=R_rot_mat, rot_mat2=R_rot_mat,
                       r_min=-r1, step=step)
    if ccc_check is False:
        if type == 'RSL':
            traj = CSCtraj(s_pt, g_pt, s_yaw, s_v, g_v,
                           rot_mat1=R_rot_mat, rot_mat2=L_rot_mat,
                           r_turn1=-r1, r_turn2=r2, step=step)
        elif type == 'RSR':
            traj = CSCtraj(s_pt, g_pt, s_yaw, s_v, g_v,
                           rot_mat1=R_rot_mat, rot_mat2=R_rot_mat,
                           r_turn1=-r1, r_turn2=-r2, step=step)
        elif type == 'LSR':
            traj = CSCtraj(s_pt, g_pt, s_yaw, s_v, g_v,
                           rot_mat1=L_rot_mat, rot_mat2=R_rot_mat,
                           r_turn1=r1, r_turn2=-r2, step=step)
        elif type == 'LSL':
            traj = CSCtraj(s_pt, g_pt, s_yaw, s_v, g_v,
                           rot_mat1=L_rot_mat, rot_mat2=L_rot_mat,
                           r_turn1=r1, r_turn2=r2, step=step)
        else:
            print("check trajectory type!")
    return traj
1
2
3
4
5
6
7
8
9
10
11
12
13
14
15
16
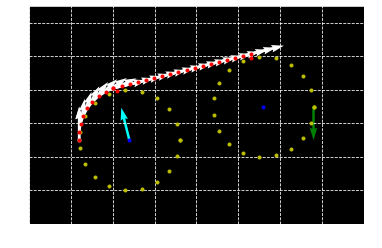
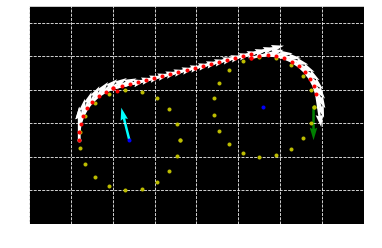
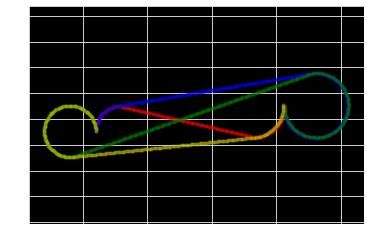
#configuration
s = np.array([1., 5., math.pi*(1./2.)])
g = np.array([15.5, 7., math.pi*(1./2.)])
plt.cla()
plt.grid(True)
plt.axis("equal")
traj = mk_traj(s, g, r1 = 2., r2 = 2.5, type = 'RSL', step=0.1)
plt.plot(traj[:,0],traj[:,1],'.r', alpha=0.3)
traj = mk_traj(s, g, r1 = 2., r2 = 2.5, type = 'RSR', step=0.1)
plt.plot(traj[:,0],traj[:,1],'.b', alpha=0.3)
traj = mk_traj(s, g, r1 = 2., r2 = 2.5, type = 'LSR', step=0.1)
plt.plot(traj[:,0],traj[:,1],'.g', alpha=0.3)
traj = mk_traj(s, g, r1 = 2., r2 = 2.5, type = 'LSL', step=0.1)
plt.plot(traj[:,0],traj[:,1],'.y', alpha=0.3)
1
[<matplotlib.lines.Line2D at 0x7f33e3399470>]
1
2
3
4
5
6
7
8
9
10
11
12
13
14
15
16
17
18
19
20
21
22
23
24
25
26
27
28
29
30
31
32
33
34
35
36
37
38
39
40
41
42
43
from IPython.display import HTML
from matplotlib.animation import FuncAnimation

frames = range(500)
f, axes =  plt.subplots()

def animation(i):
    #configuration
    plt.cla()
    plt.grid(True)
    plt.axis("equal")

    s = np.array([1., 5., math.pi*(1./2.)])
    g = np.array([15.5, 7., math.pi*(1./2.)])

    traj = mk_traj(s, g, r1 = 2., r2 = 2.5, type = 'RSL', step=0.1)
    if i<len(traj):
        plt.plot(traj[:i,0],traj[:i,1],'.r', alpha=0.3)
    else:
        plt.plot(traj[:,0],traj[:,1],'.r', alpha=0.3)
    traj = mk_traj(s, g, r1 = 2., r2 = 2.5, type = 'RSR', step=0.1)
    if i<len(traj):
        plt.plot(traj[:i,0],traj[:i,1],'.b', alpha=0.3)
    else:
        plt.plot(traj[:,0],traj[:,1],'.b', alpha=0.3)
    traj = mk_traj(s, g, r1 = 2., r2 = 2.5, type = 'LSR', step=0.1)
    if i<len(traj):
        plt.plot(traj[:i,0],traj[:i,1],'.g', alpha=0.3)
    else:
        plt.plot(traj[:,0],traj[:,1],'.g', alpha=0.3)
    traj = mk_traj(s, g, r1 = 2., r2 = 2.5, type = 'LSL', step=0.1)
    if i<len(traj):
        plt.plot(traj[:i,0],traj[:i,1],'.y', alpha=0.3)
    else:
        plt.plot(traj[:,0],traj[:,1],'.y', alpha=0.3)


ani = FuncAnimation(
        fig=f, func=animation,
        frames=frames,
        blit=False) # True일 경우 update function에서 artist object를 반환해야 함

HTML(ani.to_html5_video())

1
2
3
4
5
6
7
8
9
10
11
12
13
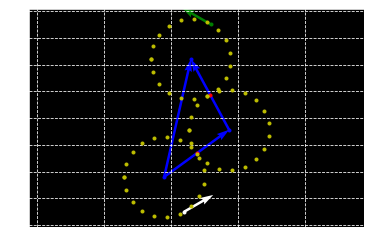
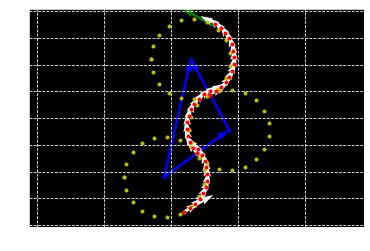
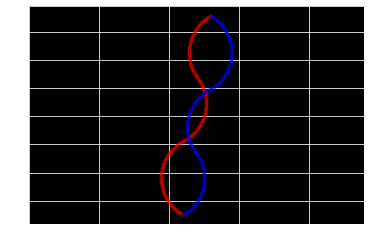
plt.cla()
plt.grid(True)
plt.axis("equal")
s = np.array([1.,-3.,math.pi*(5./6.)])
g = np.array([3.,11.,math.pi*(1./6.)])
traj = mk_traj(s, g, r1= 3., type = 'RLR', step=0.1)
plt.plot(traj[:,0],traj[:,1],'.r', alpha=0.3)
s = np.array([1.,-3.,math.pi*(1./6.)])
g = np.array([3.,11.,math.pi*(5./6.)])
traj = mk_traj(s, g, r1= 3., type = 'LRL', step=0.1)
plt.plot(traj[:,0],traj[:,1],'.b', alpha=0.3)
1
[<matplotlib.lines.Line2D at 0x7f33e367ecc0>]
1
2
3
4
5
6
7
8
9
10
11
12
13
14
15
16
17
18
19
20
21
22
23
24
25
26
27
28
29
30
31
32
frames = range(200)
f, axes =  plt.subplots()

def animation(i):
    #configuration
    plt.cla()
    plt.grid(True)
    plt.axis("equal")

    s = np.array([1.,-3.,math.pi*(5./6.)])
    g = np.array([3.,11.,math.pi*(1./6.)])
    traj = mk_traj(s, g, r1= 3., type = 'RLR', step=0.1)
    if i < len(traj):
        plt.plot(traj[:i,0],traj[:i,1],'.r', alpha=0.3)
    else:
        plt.plot(traj[:,0],traj[:,1],'.r', alpha=0.3)

    s = np.array([1.,-3.,math.pi*(1./6.)])
    g = np.array([3.,11.,math.pi*(5./6.)])
    traj = mk_traj(s, g, r1= 3., type = 'LRL', step=0.1)
    if i < len(traj):
        plt.plot(traj[:i,0],traj[:i,1],'.b', alpha=0.3)
    else:
        plt.plot(traj[:,0],traj[:,1],'.b', alpha=0.3)


ani = FuncAnimation(
        fig=f, func=animation,
        frames=frames,
        blit=False) # True일 경우 update function에서 artist object를 반환해야 함

HTML(ani.to_html5_video())


Leave a comment