Global 좌표와 Local좌표의 변환방법을 알아보자
1
2
3
import matplotlib.pyplot as plt
import math
import numpy as np
Coordination
local coordination은 x축이 진행방향이고 right handed system이다.
1
2
3
4
5
6
7
8
9
10
11
12
13
14
15
16
17
18
19
20
def pltset():
    f, ax = plt.subplots()
    plt.grid()
    plt.xlim(-15,15)
    plt.ylim(-15,15)
    plt.axvline(x=0, color='y', linestyle='--', linewidth=3, alpha=0.5)
    plt.axhline(y=0, color='y', linestyle='--', linewidth=3, alpha=0.5)

def z_axis_transfrom_op(yaw, pos):

    cy = math.cos(yaw)
    sy = math.sin(yaw)
    x = pos[0]
    y = pos[1]
    z = pos[2]

    return np.array([[cy, -sy, 0, x],
                      [sy, cy, 0, y],
                      [0, 0, 1, z],
                      [0, 0, 0, 1]])
1
2
3
4
5
6
7
8
9
10
11
12
# plt setting
pltset()

# plot
car_pos1 = np.array([0,0,0,1]).reshape(-1,1)
car_pos2 = np.array([1,0,0,1]).reshape(-1,1)
car = np.append(car_pos1, car_pos2, axis=1)
v = car[:,1] - car[:,0]

plt.scatter(car[0][0], car[1][0] ,s=150, marker='*', color='red')
# plt.scatter(car[0][1], car[1][1] ,s=50, marker='x', color='blue')
plt.quiver(car[0][0], car[1][0], v[0], v[1], color=['red'], scale=10)
1
<matplotlib.quiver.Quiver at 0x7f7b6dde2ac8>
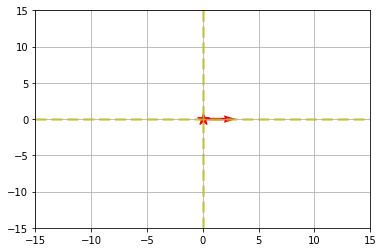
Robotic에서 많은 경우에 위의 경우와 같이 Local 좌표계에서
북쪽을 x축 기준으로 하며 yaw를 북측기준 시계방향으로 설정한다.
우선 변환 matrix를 나타내보자. 현재의 frame을 {A}라고 하고 변환 후의 frame을 {B}라고 하자.
frame 변환 matrix는 다음과 같이 나타낼 수 있다.
\[_{A}^{B}T = \begin{bmatrix} _{A}^{B}R & _{AORG}^{B}P \\ 0 & 1 \\ \end{bmatrix} = \begin{bmatrix} cos\phi & -sin\phi & 0 & x \\ sin\phi & cos\phi & 0 & y \\ 0 & 0 & 1 & z \\ 0 & 0 & 0 & 1 \\ \end{bmatrix}\]$_{A}^{B}T : ^{A}P \rightarrow ^{B}P$ 는
z축으로 90도 회전하는 변환이며 아래와 같이 표현된다.
\(_{A}^{B}T = \begin{bmatrix}
0 & -1 & 0 & 0 \\
1 & 0 & 0 & 0 \\
0 & 0 & 1 & 0 \\
0 & 0 & 0 & 1 \\
\end{bmatrix}\)
1
2
3
4
5
6
7
8
9
10
11
12
13
# plt setting
pltset()

# plot
yaw = math.pi / 2
a_trans_b = z_axis_transfrom_op(yaw, car[:,0])
local_car = np.matmul(a_trans_b,car)

v = local_car[:,1] - local_car[:,0]

plt.scatter(local_car[0][0], local_car[1][0] ,s=150, marker='*', color='red')
# plt.scatter(car[0][1], car[1][1] ,s=50, marker='x', color='blue')
plt.quiver(local_car[0][0], local_car[1][0], v[0], v[1], color=['red'], scale=10)
1
<matplotlib.quiver.Quiver at 0x7f7b6d6aada0>
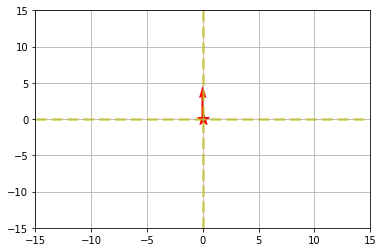
위 그림은 local 좌표계를 나타낸다.
Local 에서 Global 으로의 변환
local coordination을 B frame이라고 하고,
global coordination을 C frame이라고 하자.
이 때, B frame에서 C frame으로 변환해보자.
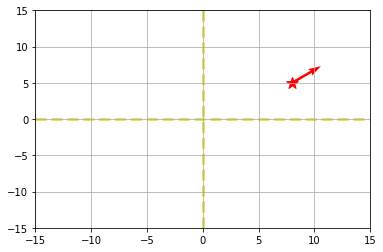
A frame에서 차가 갖고있는 위치정보는 다음과 같다고 하자. \(yaw(\phi) = \frac{\pi}{6} \\ \mbox{global position} = \begin{bmatrix} 8 \\ 5 \\ 0 \\ 0 \\ \end{bmatrix}\)
위에 나타나 있는 A frame 정보를 사용하면 \(\\_{A}^{C}T = \begin{bmatrix} cos\frac{\pi}{6} & - sin\frac{\pi}{6} & 0 & 8 \\ sin\frac{\pi}{6} & cos\frac{\pi}{6} & 0 & 5 \\ 0 & 0 & 1 & 0 \\ 0 & 0 & 0 & 1 \\ \end{bmatrix}\)
local 좌표에서 global 좌표로 변환하려면 $-\frac{\pi}{2}$ 만큼 회전하고 다시 $\frac{\pi}{6} $ 만큼 회전하고 $(8,5,0)$ 만큼 이동을 하면 된다.
이것을 수식으로 나타내면 다음과 같다.
B에서 C frame으로 변환시 B에서 A 로 변환을 하고 A에서 C 로 변환을 해야한다. 아는 변환식을 사용해 표현하면,
\({}_{B}^{C}T = {}_{A}^{C}T_{B}^{A}T = {}_{A}^{C}T({}_{A}^{B}T)^{-1}\)
임의의 yaw = $\phi$ 와 global position = $(x,y,z)$ 에대해서 위의 변환식을 풀면 아래와 같다.
\({}_{B}^{C}T = \begin{bmatrix}
cos\phi & - sin\phi & 0 & x \\
sin\phi & cos\phi & 0 & y \\
0 & 0 & 1 & z \\
0 & 0 & 0 & 1 \\
\end{bmatrix}
\begin{bmatrix}
0 & 1 & 0 & 0 \\
-1 & 0 & 0 & 0 \\
0 & 0 & 1 & 0 \\
0 & 0 & 0 & 1 \\
\end{bmatrix}
= \begin{bmatrix}
sin\phi & cos\phi & 0 & x \\
-cos\phi & sin\phi & 0 & y \\
0 & 0 & 1 & z \\
0 & 0 & 0 & 1 \\
\end{bmatrix}\)
1
2
3
4
5
6
7
8
9
10
11
12
pltset()

yaw = math.pi/6
car_pos = np.array([8,5,0]).reshape(-1,1)
a_trans_c = z_axis_transfrom_op(yaw, car_pos[:,0])
b_trans_c = np.matmul(a_trans_c, np.linalg.inv(a_trans_b))
global_car = np.matmul(b_trans_c, local_car)
v = global_car[:,1] - global_car[:,0]

plt.scatter(global_car[0][0], global_car[1][0] ,s=150, marker='*', color='red')
# plt.scatter(global_car[0][1], global_car[1][1] ,s=50, marker='x', color='blue')
plt.quiver(global_car[0][0], global_car[1][0], v[0], v[1], color=['red'], scale=10)
1
<matplotlib.quiver.Quiver at 0x7f7b6d6289b0>
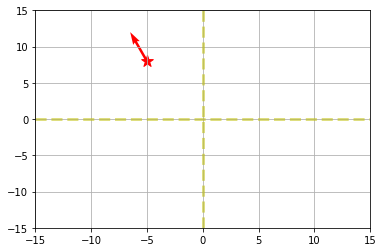
Robotic에서 많은 경우에 Global 좌표계에서
북쪽을 x축 기준으로 하며 yaw를 북측기준 시계방향으로 설정한다.
따라서 현재의 frame을 {C}라고 하고 변환 후의 frame을 {D}라고 하자.
$_{C}^{D}T : ^{C}P \rightarrow ^{D}P$ 의 변환은
z축으로 90도 회전하는 변환이며 아래와 같이 표현된다.
역변환을 구하는 방법은 아래와 같다. \(_{B}^{A}T = (_A^BT)^{-1} = \begin{bmatrix} (_{A}^{B}R)^{T} & -(_{A}^{B}R)^{T}{}_{AORG}^{B}P \\ 0 & 1 \\ \end{bmatrix}\)
local frame 인 {B} 에서 global frame인 {D}로의 변환은 \(_{B}^{D}T = _C^DT _A^CT (_A^BT)^{-1} = _{C}^{D}T _{B}^{C}T = \begin{bmatrix} 0 & -1 & 0 & 0 \\ 1 & 0 & 0 & 0 \\ 0 & 0 & 1 & 0 \\ 0 & 0 & 0 & 1 \\ \end{bmatrix} \begin{bmatrix} sin\phi & cos\phi & 0 & x \\ -cos\phi & sin\phi & 0 & y \\ 0 & 0 & 1 & z \\ 0 & 0 & 0 & 1 \\ \end{bmatrix} = \begin{bmatrix} cos\phi & -sin\phi & 0 & -y \\ sin\phi & cos\phi & 0 & x \\ 0 & 0 & 1 & z \\ 0 & 0 & 0 & 1 \\ \end{bmatrix}\)
1
2
3
4
5
6
7
8
9
10
11
pltset()

car_pos = np.array([0,0,0]).reshape(-1,1)
yaw = math.pi / 2
c_trans_d = z_axis_transfrom_op(yaw, car_pos[:,0])
global_car = np.matmul(c_trans_d, global_car)
v = global_car[:,1] - global_car[:,0]

plt.scatter(global_car[0][0], global_car[1][0] ,s=150, marker='*', color='red')
# plt.scatter(global_car[0][1], global_car[1][1] ,s=50, marker='x', color='blue')
plt.quiver(global_car[0][0], global_car[1][0], v[0], v[1], color=['red'], scale=10)
1
<matplotlib.quiver.Quiver at 0x7f7b6d65bac8>
Global 에서 Local로 변환
$_{D}^{B}T : ^{D}P \rightarrow ^{B}P$ 의 변환은
$_{B}^{D}T : ^{B}P \rightarrow ^{D}P$ 의 변환의 역변환이므로
\[_{D}^{B}T = _{B}^{D}T^{-1} = (_{C}^{D} T _{B}^{C}T)^{-1} = \begin{bmatrix} \begin{bmatrix} cos\phi & sin\phi & 0 \\ -sin\phi & cos\phi & 0 \\ 0 & 0 & 1 \\ \end{bmatrix} & -\begin{bmatrix} cos\phi & sin\phi & 0 \\ -sin\phi & cos\phi & 0 \\ 0 & 0 & 1 \\ \end{bmatrix} \begin{bmatrix} -y \\ x \\ z \\ \end{bmatrix} \\ \begin{bmatrix} 0 & 0 & 0 \end{bmatrix} & 1 \end{bmatrix} \\ =\begin{bmatrix} cos\phi & sin\phi & 0 & ycos\phi-xsin\phi \\ -sin\phi & cos\phi & 0 & -ysin\phi-xcos\phi \\ 0 & 0 & 1 & -z \\ 0 & 0 & 0 & 1 \\ \end{bmatrix}\]1
2
3
4
5
6
7
8
9
10
11
pltset()
car_pos = np.array([0,0,0]).reshape(-1,1)
yaw = math.pi / 2
b_trans_d = np.matmul(c_trans_d, b_trans_c)
d_trans_b = np.linalg.inv(b_trans_d)
local_car = np.matmul(d_trans_b,global_car)
v = local_car[:,1] - local_car[:,0]
plt.scatter(local_car[0][0], local_car[1][0] ,s=150, marker='*', color='red')
# plt.scatter(local_car[0][1], local_car[1][1] ,s=50, marker='x', color='blue')
plt.quiver(local_car[0][0], local_car[1][0], v[0], v[1], color=['red'], scale=10)
1
<matplotlib.quiver.Quiver at 0x7f7b6d584a90>
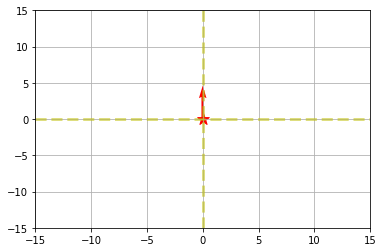
다시 원래의 좌표로 돌아오는 것을 알수 있다.
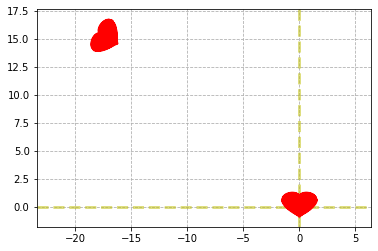
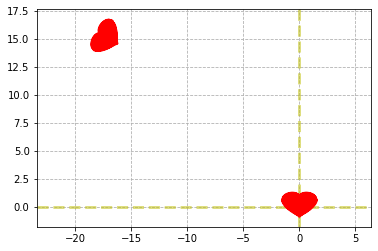
위와 같은 변환 행렬을 통하면 point cloud를 한번에 변환할 수 있다.
point cloud의 변환
다수의 point를 한번에 transformation matrix를 통해서 효과적으로 옮겨보자.
point cloud의 local 에서 global로 변환
1
import math
1
2
3
4
5
6
7
8
9
10
11
12
def local_to_global_matrix(location, yaw):
    x,y,z = location[0], location[1], location[2]
    cy = math.cos(yaw)
    sy = math.sin(yaw)
    x = location[0]
    y = location[1]
    z = location[2]

    return np.array([[cy, -sy, 0, -y],
                      [sy, cy, 0, x],
                      [0, 0, 1, z],
                      [0, 0, 0, 1]])
1
2
3
4
5
6
7
8
9
10
11
12
13
14
15
16
17
18
19
20
plt.cla()
plt.grid(linestyle='--')
plt.axvline(x=0, color='y', linestyle='--', linewidth=3, alpha=0.5)
plt.axhline(y=0, color='y', linestyle='--', linewidth=3, alpha=0.5)
plt.axis("equal")

location = [15,17,0]
yaw = math.pi*1/3

f = lambda x: np.sqrt(np.cos(x)) * np.cos(80 * x) + 0.5 * np.sqrt(abs(x))
x = np.linspace(-math.pi/2, math.pi/2, 1000)
y = f(x)
plt.plot(x,y, color='red')

l2g_matrix = local_to_global_matrix(location, yaw)
x = x.reshape(1,-1)
y = y.reshape(1,-1)
local_location = np.concatenate([x,y,np.zeros_like(x),np.ones_like(x)],axis=0)
global_location = np.matmul(l2g_matrix,local_location)
plt.plot(global_location[0,:],global_location[1,:], color='red')
1
[<matplotlib.lines.Line2D at 0x7f7b6d4fa9b0>]
point cloud의 global 에서 local로 변환
1
2
3
4
5
6
7
8
9
10
11
12
def global_to_local_matrix(location, yaw):
    x,y,z = location[0], location[1], location[2]
    cy = math.cos(yaw)
    sy = math.sin(yaw)
    x = location[0]
    y = location[1]
    z = location[2]

    return np.array([[cy, sy, 0, y * cy - x * sy],
                      [-sy, cy, 0, -y * sy - x * cy],
                      [0, 0, 1, z],
                      [0, 0, 0, 1]])
1
2
3
4
5
6
7
8
9
10
11
12
plt.cla()
plt.grid(linestyle='--')
plt.axvline(x=0, color='y', linestyle='--', linewidth=3, alpha=0.5)
plt.axhline(y=0, color='y', linestyle='--', linewidth=3, alpha=0.5)
plt.axis("equal")
plt.plot(global_location[0,:],global_location[1,:], color='red')

g2l_matrix = global_to_local_matrix(location, yaw)
x = x.reshape(1,-1)
y = y.reshape(1,-1)
restored_local_location = np.matmul(g2l_matrix, global_location)
plt.plot(restored_local_location[0,:],restored_local_location[1,:], color='red')
1
[<matplotlib.lines.Line2D at 0x7f7b6cfdc4e0>]


Leave a comment